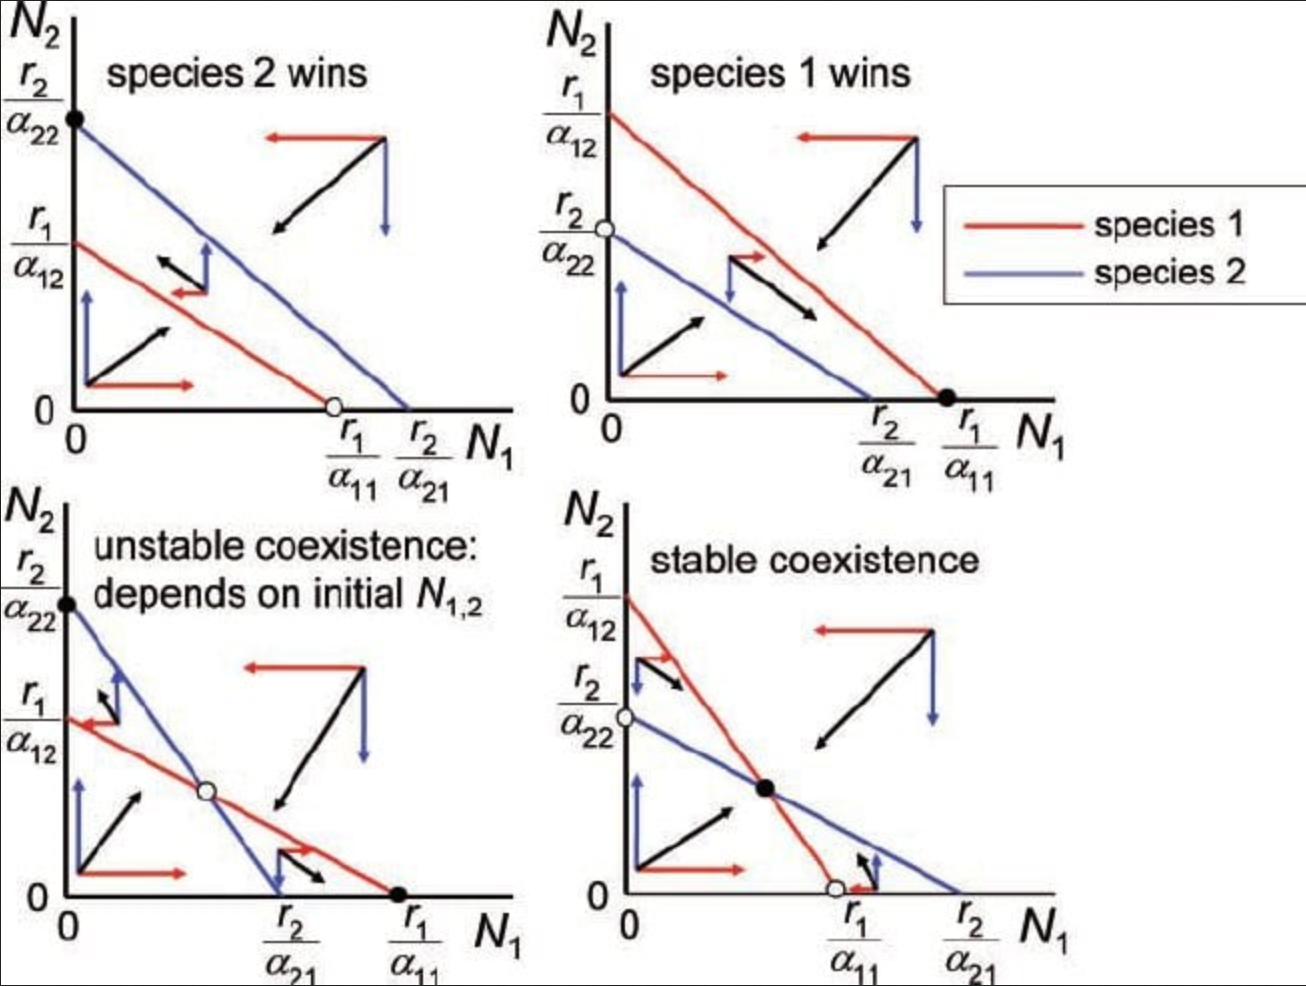
The Vague Plan Vibes Summary
June 22, 2026
Overview
The basic idea of what I want to produce is an R package or a few functions that can be used to easily create plots of ecological models from real life data. Since this project is just for my own practice, I don't plan to host my package anywhere. This is mainly to get better at programming and to help my understanding of how math plays a role in ecology. Almost all of the models used in ecology do not fit real life perfectly, I do not intend to make a package that can be used widely but maybe a few things will become easier with some prewritten functions. It is also likely that someone has already done what I am hoping to accomplish, I'm okay with that as long as I learn something new.
I am starting small with only two models that will be used to create two functions. These functions will both output a plot based on data input. Ideally, someone can just plug in their cleaned data set columns to get an output but it is likely that I will have to write some preliminary functions. The two models I plan to start with are Lotka-Volterra and the R* rule which are both used for assessing competition between two species.
Lotka-Voltera Models
L-V models are used to predict population dynamics between two species with a shared resource, they can also be used to predict the outcome of predator-prey interactions. For now, I am focusing on competition between two species. The equation for the competitive model between two species looks like this:
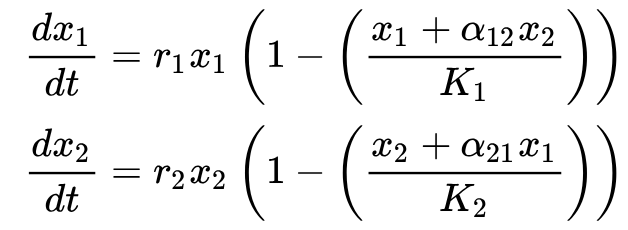
I plan to go over my exact use of this model in more detail in later posts but essentially, I want to write a function that allows someone to plug in values for these different variables and get a plot of population over time in return.
R* Rule
The R* hypothesis is very similar to an L-V model except it looks only at the resource amount for each of the two species and ignores if a species interferes with its' ability to consume the resource. Below is the formula for this model.

My goals with this model are the exact same as for the Lotka-Volterra model except instead it will be population over resource availability.
Conclusion
Ok, that's it for now! I am hoping to have updates every week or at least every other week so come back soon!